Plant PhenoLab – an automated phenotyping platform

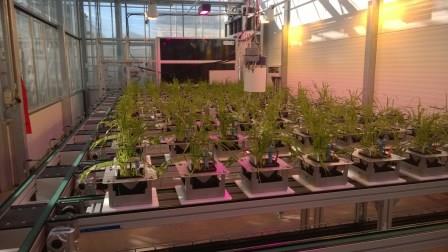
Plant PhenoLab is a prototype of a fully automated, high-throughput phenotyping platform comprising of an automatic system for plant care and movement in combination with a vision station for monitoring and measurements.
PhenoLab is installed in cell 12 in the new greenhouse in Taastrup.
The automatic system
The automatic system consists of 13 lanes and a circular transport lane of conveyor belts with space for up to 117 fixtures. One plant (13x13 cm pot) or four plants (8x8 cm pots) can be mounted in each fixture.
The fixtures move with a maximum speed of 8 m/min and all direction changes are smooth.
The fixtures can be randomized, rotated, photo measured, weighed and irrigated twice a day (or less if preferred)
Irrigation with up to four different nutrient mixtures can be done either at soil level or into the fixture reservoir.
Soil water potential is measured continuously by a sensor probing each fixture and the individual irrigation amount is adjusted according to the water content of the soil. (This part is under development - meanwhile irrigation is based on weight changes.)
The maximum plant size in PhenoLab is 60 cm height and 25 cm width.
The vision station
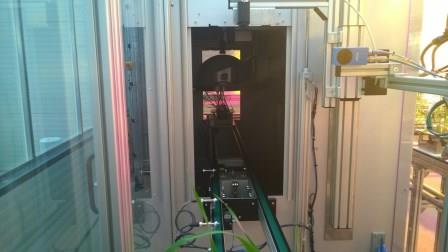
The vision station consists of a box with no day light where cameras and LEDs are mounted.
Before entrance to the vision box all plants are measured regarding plant height in order to adjust camera positions.
The vision station has 2 thermocameras (LWIR 8000-15000 nm) - one inside and one outside the box.
A multispectral camera (VISLab) is mounted inside the box. Pictures are taken at ten different wave lengths in the interval from 365 to 970 nm performed by LEDs.
Filters are mounted for fluorescence measurement at the VISLab position.
The vision station is prepared for a side view camera and for short wave multispectral camera (SWIR).
The vision box includes a rotation station where plants can be rotated if preferred.

Data management
The automatic system is controlled by an interface where all settings regarding irrigation, nutrition, weighing, photo measurement, rotation, randomization, sample ordering etc. are carried out.
A fixture constitutes the smallest statistical unit and is identified by a RFID tag.
Data on soil temperature and soil humidity (conductivity) is registered every 15 minutes by the Parrot.
Data on plant weight, plant height, irrigation and nutrition is registered twice a day or when the plants passes the read out station at the entrance of the vision station.
All data read outs including photos are tied together in an SCL database format.
Interpretation of data is not included in the delivery from PhenoLab.
Live video from Plant PhenoLab
If you like to watch live pictures from Plant PhenoLab you can contact Rene Hvidberg Petersen for login information.
More information
Rene Hvidberg Petersen regarding booking and use of PhenoLab.
Jesper Cairo Westergaard regarding interpretation of data.
Contact
Agrovej 12
2630 Taastrup
For general inquiries:
greenhouseTAA@plen.ku.dk
Team Leader
Rene Hvidberg Petersen
29611843
rhvp@plen.ku.dk
